ORIGINAL
Estimation and comparison of conventional and genomic breeding values in Holstein cattle of Antioquia, Colombia
Estimación y comparación de valores de cría convencionales y genómicos en ganado Holstein de Antioquia, Colombia
Juan Zambrano A,1* M.Sc, Juan Rincón F,2 M.Sc, Albeiro López H,2 Dr.Sci, Julián Echeverri Z,2 Ph.D.
1Universidad Nacional de Colombia sede Medellín, Facultad de Ciencias, Posgrado en Biotecnología, Grupo de Investigación BIOGEM A.A. Nro. 3840, Medellín, Colombia.
2Universidad Nacional de Colombia sede Medellín, Facultad de Ciencias Agropecuarias, Departamento de producción Animal, Grupo de Investigación BIOGEM, A.A. Nro. 1779, Medellín, Colombia.
*Correspondence: jczambranoa@unal.edu.co
Received: July 2014; Acecpted: February 2015.
ABSTRACT
Objective. To estimate and compare breeding values (EBV) using the conventional method (BLUP) and genomic breeding values (MEBV and GEBV) estimated through bayes C method for milk yield and milk quality traits in dairy cattle in Antioquia, Colombia. Materials and methods. Two methods were used to estimate breeding values: BLUP to estimate conventional breeding value (EBV) and bayes C to estimate genomic values (MEBV and GEBV). The traits evaluated were: milk yield (PL), protein percentage (PPRO), fat percentage (PGRA) and score somatic cell (SCS). The methods (BLUP and bayes C) were compared using Person correlation (rp), Spearman rank correlation (rs) and linear regression coefficient (b). Results. The Pearson and Spearman correlations among EBVs and genomic values (MEBV and GEBV) (rpMEBV;EBV and rsGEBV;EBV) were greater than 0.93 and the linear regression coefficients of EBVs on genomic values (MEBV and GEBV) (bMEBV;EBV, and bGEBV;EBV) ranged between 0.954 and 1.051 in all traits evaluated. Conclusions. The predictions of genomic values (MEBV and GEBV), using bayes C method were consistent with the predictions of the EBVs estimate through the conventional method (BLUP) in conditions of high Colombian tropic, allowing to obtain high associations between the breeding values.
Key words: BLUP, genotypes, genomic selection, single nucleotide polymorphism (Source: CAB, NAL).
RESUMEN
Objetivo. Estimar y comparar valores genéticos (EBV) usando el método convencional (BLUP) y valores genómicos (MEBV y GEBV) mediante el método bayes C en características de producción y calidad de la leche en ganado Holstein de Antioquia, Colombia. Materiales y métodos. Fueron empleados dos métodos para estimar valores genéticos: BLUP para estimar valores genéticos (EBV) y Bayes C para estimar valores genómicos (MEBV y GEBV). Las características evaluadas fueron: producción de leche (PL), porcentaje de proteína (PPRO), porcentaje de grasa (PGRA) y puntaje de células somáticas (SCS). Los métodos BLUP y bayes C fueron comparadas usando correlación de Pearson (rp), correlación por rangos de Spearman (rs) y regresión lineal (b). Resultados. Las correlaciones de Pearson y Spearman entre los EBVs y los valores genómicos (MEBV y GEBV) (rpMEBV;EBV y rsGEBV;EBV) fueron mayores de 0.93 y los coeficientes de regresión entre los EBVs y los valores genómicos (MEBV y GEBV) (bMEBV;EBV, y bGEBV;EBV) oscilaron entre 0.954 y 1.051 en todas las características evaluadas. Conclusiones. La predicción de valores genómicos (MEBV y GEBV) usando el método Bayes C fue consistente con los EBVs estimados mediante el método BLUP en condiciones del trópico alto colombiano, permitiendo obtener altas asociaciones entre los valores genéticos.
Palabras clave: BLUP, genotipos, polimorfismo de nucleótido simple, selección genómica (Fuente: CAB, NAL).
INTRODUCTION
The genetic improvement of plants and domestic animals includes among its stages, the prediction of estimated breeding values (EBV) with the objective of improving the genetic potential of next generations. Traditionally, EBVs are obtained by using the best linear unbiased prediction (BLUP) (1). This method is based on assumptions of the infinitesimal model, which assumes that the quantitative traits are determined by an infinite number of loci that act in an additive form, with no linkage among them. Each one with a very small effect on phenotypical expression of the traits (2,3). Although the BLUP method has been widely used for genetic progress of domestic species, its main limitation is the strict dependency on productive records to obtain high reliability in genetic evaluations (4).
Advances in genetics, molecular biology and other scientific areas have demonstrated that the quantitative traits are affected by an infinite number of loci, some with great effect, others with small effect and others with no effect on the traits (finitesimal model) (3,5,6). With this approach, the termed marker-assisted selection (MAS) was initially incorporated in commercial applications, but with little success since it was directed to the use of individual genes or a small amount of QTL (quantitative trait loci) linked to markers that allow to capture only a small part of the genetic variance (7).
Thanks to the development of DNA sequencing technologies, a large number of genetic markers have been identified, being the single nucleotide polymorphism (SNP) among the highest. Currently, several types of microarrays allow for the identification of thousands of SNPs and are used in genotyping of some domestic species that are commercially available and at low cost (8). These microarray that include multiple SNP panels and cover all the genome in a uniform distribution, have been of great use in animal genotyping (9). Through the genomic selection methodology (SG) devised by Meuwissen et al (6), genomic information from genotyped animals with multiple SNPs can be used efficiently to estimate genomic values (GEBVs), which are SG’s main point, given that selection decisions are based on these values. The genomic value (GEBV), is the result of the sum of the effects of allelic substitution of all markers (SNP) associated with a phenotypic trait. These effects are estimated in selected populations that carry phenotypic and genealogical information and are later used in the estimation of GEBVs in young animals (8). Considering these arguments, several genetic value estimation methods that include molecular markers have been propose, such as bayes A, bayes B, bayes C, bayes Cpi, bayes lasso, bayes R, GBLUP. The main difference between these methods is in the a priori information included in the genomic model with respect to the distribution of the marker’s effects (6,10-12).
A big advantage in incorporating genomic information in conventional genetic evaluations is the increase in the reliability of genetic values in young animals and the decrease of the generation interval (13). This has led to many genetic improvement programs developed in several countries worldwide to include genomic information in their genetic evaluations; this strategy has worked and has allowed doubling the genetic gain in many characteristics of economic importance (8,14).
In Colombia, few genetic evaluations have been developed in dairy cattle. But due to the low number of animals evaluated and the limited amount of phenotypic observations, the reliability of EBVs has been low. Genomic evaluations have not yet been incorporated into dairy cattle, although some previous studies have been conducted (15). The objective of this research was to estimate and compare genetic values (EBV) using the conventional method (BLUP) and genomic breeding value (MEBV and GEBV) estimated through bayes C method for milk yield and milk quality traits in dairy cattle in Antioquia, Colombia.
MATERIALS AND METHODS
Population. This research was conducted based on information from 124 dairy herds of Holstein breed located in 18 municipalities of the department of Antioquia (Colombia), which covers very wet low mountain (bmh-mb) areas, with a temperature that ranges between 12 and 18°C and a yearly average of rain between 2000 and 4000 mm. These dairy herds are normally located at an altitude of between 1800 to 2800 msnm above sea level. The specific conditions of handling, feeding and sanity, as well as their topography and geographic location varied in all dairy herds. The Ethics Research Committee of the National University of Colombia in Medellin supported this research, because it complied with the standards for this type of research (Approval number: CEMED-015 May, 2012).
The number of records used for the analysis varied according to the dependent variables analyzed: 8772, 6624, 6595 and 6426 for PL, PGRA, PPRO y and somatic cell count (RCS) respectively. RCS was transformed to a somatic cell score (SCS) using the following equation: SCS = [log2 (RCS/100000)] + 3, in order to improve the normality of the data, as described by Ali and Shook (16). The number of animals in the pedigree for the conventional genetic evaluation was 9090 individuals and for the genomic evaluation the number was 260, which corresponds to the genotyped animals and their relatives. All the information was administered and analyzed in Control 1 Software, version 1.0 (17).
According to the initial descriptive analysis, PL values greater than 12000 and less than 1500 liters/lactation were discarded. Levels lower than 2.00% and greater than 5.00% for PPRO and less than 1.60% and greater than 6.00% for PGRA were also discarded since they are considered possible sampling errors or errors in the lab’s procedures.
Animal genotyping with high-density beadchips. 144 animals were genotyped with Illumina (Illumina Inc., San Diego, CA) beadchips for multiple SNPs: 31 with the Bovine LD beadchip, 65 with the Bovine SNP50v2 beadchip and 48 with the Bovine HD beadchip, which provide information of 6.909, 54.609 and 777.972 SNPs respectively. During the handling of the genotypes, the alleles with the lowest frequency were removed when these were lower than 0.02. Genotypes with mendelian errors were also declared as lost data. Finally, after editing the information, 6716 SNPs common to all three types of beadchips (LD, SNP50 and HD) were obtained for all the genotyped animals. The edition of genotypes was conducted with the programs SAS v9.1 (18) and Plink v1.07 (19).
Statistical analysis.
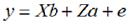
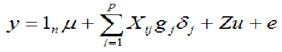
EBVs Estimation by BLUP. Through preliminary analysis, several statistical models were proven that included significant fixed effects for each trait in order to determine the models that were best adjusted to the estimation of the genetic parameters. variance components and heritability were estimated using an independent univariate animal model for each characteristic (20). The matrix notation of the model was described as follows:
Where: y = observation vector, b = solution vector for fixed effects of the herd, number of calving (cows between 1 and 8 calving), covariates: lactation length for PL and milk yield (PL) for PPRO and PGRA traits, a= solution vector for random additive genetic effect, X and Z = incidence matrix that relate the records with fixed and random effects and e = residual.
It is assumed that the random and residual additive genetic effects are distributed independently with zero medium and variances:
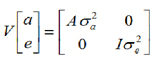
Considering that A = relationship matrix and:  , you have to:
The mixed model equations for the best linear unbiased estimator (BLUE) of the estimated functions for b for the best linear unbiased predictor (BLUP) of a are describe as:
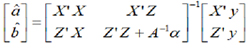
Where: a is the relationship between the residual variance and the additive genetic variance:

The model for each characteristic was resolved by using the MTDFREML program described by Boldman et al (21), which determined the solutions for each fixed effect (b) and the additive genetic random effect (a) from the mixed model equations (MME), described by Henderson (1), by using a multiple trait derivative-free restricted maximum likelihood.
The traits were estimated directly from the MTDFREML program and were considered as the proportion of the additive genetic variance over the phenotype variance.
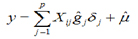
Estimation of marker effects and genomic values. The estimation of the effects of the SNPs and the genomic breeding values (MEBV and GEBV) was conducted using the Bayes C method (22). The general statistical model is describe as:
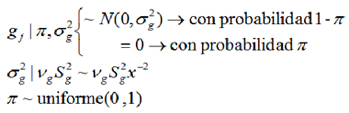
Where: y is the phenotype value vector corrected for fixed effects (corresponding to EBVs obtained through the BLUP method) for PL, SCS, PPRO, and PGRA traits, µ is the general mean, 1n is the vector of ones of n length, Xij is the column vector that represents the covariates of the marker (SNP) in locus j and animal i. In each jth marker, there are three possible combinations of two alleles (A or B), the homozygote of an allele (AA), the heterozygote (AB) and the homozygote of the other allele (BB). These combinations of alleles (genotypes) are represented quantitatively as 0, 1 and 2 respectively (that is; Xij=0, 1 o 2); gj is the random effect of allelic substitution for the marker j, which is conditional on  and is normally distributed N~(0,) when δj=1, but gj=0 when δj=0; δj is a random variable 0/1 that indicates absence (with probability P) or presence (with probability 1-P) of locus j in the model; u is the polygenic random effect vector of length n (Z is the related design matrix) and can be considered as the adjustment of the genes not considered due to the effects of jth SNPs in g; u is assumed to be normally distributed, u~N(0,
 ), where A is the relationship matrix derived from the pedigree of the genotyped animals; e is the residual and also is assumed to be normally distributed e~N(0,
 ), where I is an nxn identity matrix.
With this approach, the bayes C method assumes a combination of two distributions for the effects of the marker SNPs. The first distribution, (with π probability) established that many markers do not have effect nor variance; and the second distribution, (with 1-π probability) there are markers with effect and variance, which common for all SNPs (23).
Therefore, the effects of SNPs(gj) follow an apriori normal distribution with zero mean and variance , while the variances of the effects of the markers () follow an apriori inverse scaled chi squared-distribution with parameters Vg (degrees of freedom) and  (scale parameters). On the other hand, π is treated as a uniform apriori distribution with zero mean and variance 1 (23), as follows:
The genomic value of animals whose genotype is known was determined as:
Where: y is the genomic estimated breeding value (GEBV), ![]() corresponds to the estimated molecular breeding value (MEBV) obtained as the sum of all estimated effects (ĝj) of the SNPs; û is the polygenic effect.
corresponds to the estimated molecular breeding value (MEBV) obtained as the sum of all estimated effects (ĝj) of the SNPs; û is the polygenic effect.
The program used for the estimation of the effects of SNPs and the genomic values (MEBV and GEBV) was GS3 (24).
Methods for comparing genetic values. Genomic values (MEBV and MEBV) estimated with the bayes C method were compared to conventional genetic values (EBV), estimated with the BLUP method, using three methods: Spearman rank correlation, Pearson correlation and simple linear regression:
a) Spearman’s rank correlation coefficient was used to determine the degree of similarity between the classifications or rankings of the animals by their genomic values (MEBV or GEBV) and the classification of the same animals by the conventional EBV. The equation used was:
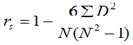
Where:
D = difference between the corresponding genetic values of (x–y) order,
x = genomic value (GEBV or MEBV),
y = conventional EBV,
N = number of pairs (x,y) and
rs = Spearman correlation coefficient.
A value of correlation 1 indicates that the classification or ranking of the animals by their genomic values (MEBV or GEBV) is similar than in the conventional EBV.
b) The Pearson correlation coefficient was used to determine the relationship between genomic values (MEBV or GEBV) and the conventional EBV. The equation used was:
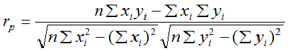
Where, rp = Pearson correlation coefficient; x=genomic value (GEBV or MEBV) for i trait; y=conventional EBV for i trait. A correlation value of 1 indicates that the methods for estimation of genetic values have the same precision and that the estimation errors are very similar.
c) The simple linear regression coefficient was used to determine the change in magnitude of the genomic values (MEBV and GEBV) with respect to conventional EBVs and allow evaluate the bias in the estimation of the genomic selection model with respect to the traditional model, according to Mäntysaari et al (25). Linear regression was defined as:
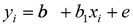
Where yi = dependent variable that corresponds to conventional EBV for i trait; xi=genomic value (GEBV or MEBV) for i characteristic; b1=EBV regression coefficient on the genomic value (GEBV or MEBV); b0 = intercept and e=residual.
RESULTS
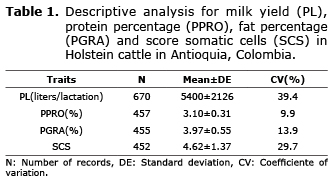
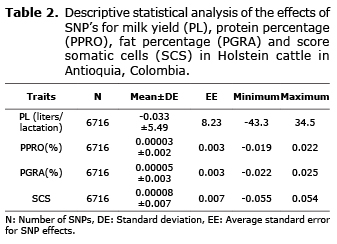
Descriptive analysis. The averages for the milk yield and quality traits presented normal values for the Holstein breed in the Colombian high tropic, with values of 5400 liters/lactation, 3.10%, 3.97% and 4.72 for PL, PPRO, PGRA and SCS respectively. The most variable trait according to the coefficiente of variation was PL with 39.9%, while the trait with the lowest variance was PPRO with 9.9% (Table 1). The effects of the SNPs for the same trait were also determined. For PL, the effects varied between -43.3 and 34.5 liters/lactation; for PPRO between -0.019 and 0.022%; for PGRA between -0.022 and 0.025% and for SCS between -0.055 and 0.054 (Table 2).
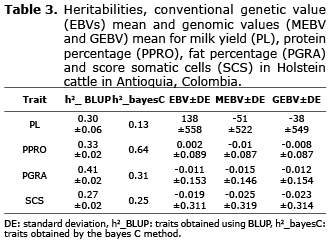
Genetic parameters, conventional EBVs and genomics (MEBV and GEBV). The heritability estimates for the bayes C method for PGRA and SCS were within the normal range and were close to the heritabilities estimates by the BLUP method. But, the heritability for PPRO was high compared to the heritability obtained with the BLUP method. The averages of the genetic values (EBV) obtained by BLUP for PL, PPRO, PGRA and SCS were: 138 liters/lactation, 0.002%, -0.011% and -0.019 respectively. For GEBVs, the averages were: -38 liters/lactation, -0.008%, -0.012% and -0.023 and for MEBVs, which were calculated as the sum of the effects of the SNPS, the averages were: 51 liters/lactation, -0.01%, -0.015% and -0.025 respectively (Table 3).
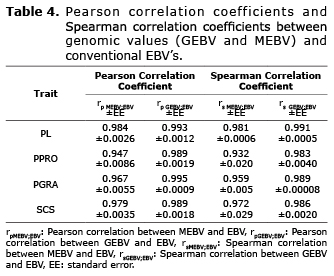
Comparison of genetic values. Pearson correlations between genomic values (GEBV and MEBV) and the conventional EBV (rpMEBV;EBV, rpGEBV;EBV) for PL, PPRO, PGRA y SCS were greater than 0.94 and Spearman correlations (rsMEBV;EBV, rsGEBV;EBV) obtained for the same trait were greater than 0.93 and in most cases close to 1, indicating high relationship between genetic values. In all cases, the correlations obtained were highly significant (p≤0.01), (Table 4).
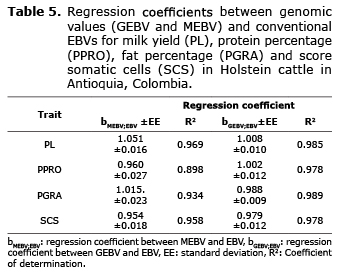
Regression coefficients (bMEBV;EBV y bGEBV;EBV) obtained for PL, PPRO, PGRA y SCS varied between 0.954 and 1.051. These results indicate that the estimation of genetic values in the population evaluated using BLUP and Bayes C methods, did not alter significantly the magnitude of the genomic values (GEBV and MEBV) with respect to the conventional EBV. Likewise, the determination coefficients (R2) for the trait evaluated (PL, PPRO, PGRA and SCS were close to 1 (greater than 0.89 for linear regressions between EBV and MEBV and greater than 0.97 for linear regressions between EBV and GEBV). This shows a high linear relationship between genetic values (the data adjusts to a straight line), (Table 5).
DISCUSSION
The genomic selection (SG), is a type of marker- assisted selection (MAS), but unlike other methodologies, includes molecular markers massively, which cover all the entire genome, in such a way that all QTL’s are in linkage disequilibrium with at least one marker (5). SG allows a favorable selection of individuals based on the breeding genomic value (GEBV) and compared with conventional BLUP (1), provides breeding values more acurate in young animals; but the BLUP method provides breeding value more acurate in older animals that have progeny tests (26). Also, SG, unlike the BLUP method, can be more efficient in both low heritability as well as in high heritability traits (27,28).
This research determined that heritabilitys for PL, PGRA, PPRO and SCS, through the BLUP and bayes C methods. Heritabilities for PL, PGRA y SCS were higher when the BLUP method was used with values between 0.30, 0.41 and 0.27, compared to the estimated using the bayes C method, with values of 0.13, 0.41 and 0.25 respectively. For PPRO, the heritability was higher using the bayes C method with a value of 0.64 and using the BLUP method the value was 0.33. VanRaden et al (13) estimated the heritabilities for milk production traits using genomic linear predictions and obtained values of 0.30 for PL, 0.50 for PPRO and PGRA and 0.12 for SCS. In both research, heritabilities are within normal ranges, except in the current research, traits for PPRO (estimated with bayes C), was two-times the heritability estimated with BLUP. According to Visscher et al (29), false associations can inflate the heritability when genomic methods are used.
In this research, conventional breeding values (EBV) were also estimated with the BLUP method and genomic values (MEBV and GEBV), obtained with the Bayes C method for milk productions and quality traits PL, PPRO, PGRA and SCS. The genomic values (MEBV and GEBV) were compared with conventional EBV using as measure the Pearson correlations (rpMEBV;EBV and rpGEBV;EBV) and Spearman correlations (rsMEBV;EBV and rsGEBV;EBV) and the linear regression coefficient (bMEBV;EBV and bGEBV;EBV). Pearson and Spearman correlations between the GEBV and the EBV were high in all cases (greater than 0.98) and linear regression coefficients of EBV on GEBV were close to 1 (ranged between 0.979 and 1.008) as indicated in tables 4 and 5. These coefficients are high since a model that combines a first random effect associated with the markers and a second effect called polygenic effect that considers the relationship matrix of genotyped animals. According to Muir et al (28), the phenotype classical selection (BLUP) can capture QTL regardless of if there is a linkage disequilibrium between QTL and the markers, meaning that it does not use molecular markers. This favors the model used in the bayes C method, since it can capture the genetic variance of QTL’s in the linkage disequilibrium with the evaluated markers and the remaining genetic variance through the polygenic effect.
Moser et al (11) used 7372 SNP genotypes and EBV’s (average reliability 89%) from 1945 Holstein bulls to predict the molecular estimated breeding value (MEBV) in PGRA, using the bayes R method. The precision and the bias of the prediction of the MEBV were calculated through a cross validation using a training group of 706 young bulls in which the MEBV was estimated and compared to the conventional EBV.
The correlation between the MEBV and the conventional EBV for PGRA was moderate (rpMEBV;EBV=0.56). Notwithstanding, when MEBV is combined with the polygenic effect obtained from the pedigree to obtain the GEBV, the correlation coefficient was higher (rpEBV;GEBV=0.62). These results corroborated the results obtained in this research for PGRA (rMEBV,EBV=0.967; rGEBV,EBV=0.995), indicating the importance of including the polygenic effect in genomic evaluations since GEBV considers a portion of the genetic variance captured for the markers and the polygenic variance not captured by the markers. However, in both investigations, the correlations are different, being higher in the investigation herein. The explanation for this difference in the results is because in this investigation, the genomic values (MEBV and GEBV) were estimated in a reference population, while in Moser et al (11) investigation, the genomic values were estimated in a validation population.
The difference between the assumptions used for each estimation method must also be considered. Bayes C assumes a fraction (π) of SNP’s without effect or variance and the remaining fraction (1- π) with effects, which are distributed as a normal fraction; while in Bayes R, although an extension of bayes C, the effects of SNP’s are assumed as multiple normal distributions (12).
Likewise, Moser et al (11), determined the regression coefficient of the EBV on the MEBV (bMEBV;EBV) for PPRO and they obtained a value of 1.06 for the bayes R estimation method. In this investigation, the regression coefficient (bMEBV;EBV) was 1.015, very similar to that obtained by the mentioned authors. These results indicate that the change in magnitude of the MEBV’s with respect to conventional EBV’s is very small. A value greater than one suggests that the markers do not capture the whole genetic variance, while a value less than 1 indicates that the genomic prediction would be inflated with respect to the conventional method (BLUP) and if such is the case, the genomic values would be biased with respect to the conventional EBV’s. On the other hand, the regression coefficient of EBV on GEBV for PGRA was slightly less than 1 (bGEBV;EBV = 0.988), because when combining the effects of the markers and the polygenic effect, the GEBV captures a greater portion of the genetic variance and therefore, it will be closer than 1 compared to the MEBV.
Verbyla et al (23), in a simulation study, evaluated 4 bayesian methods; Bayes BLUP, Bayes A, Bayes A/B and Bayes C, which were used to estimate GEBVs. GEBVs were compared to true estimated breeding value (TEBV), which were obtained by simulation. The correlation results between TEBV and GEBV, (rGEBV;TEBV) were 0.885, 0.857, 0.889 and 0.861 and the regression coefficients (bGEBV:TEBV) were: 0.979, 1.162, 1.081 and 1.024 respectively for each method. These results show that the use of relevant a priori information in bayesian regressions is of great importance in the estimation of genomic values, allowing obtaining more precise and less biased predictions.
In this investigation, correlations (rpGEBV,EBV) greater than 0.98 were obtained for PL, PPRO, PGRA and SCS and regression coefficients (bGEBV;EBV) that range between 0.979 and 1.008 for the same traits. However, although the correlations between MEBV’s and conventional EBV’s were slightly lower in all of the evaluated characteristics (rpMEBV;EBV greater than 0.93). These results are similar to those obtained by Verbyla et al (23), whom suggest that the bayesian methods are consistent in simulated data and real data.
Verbyla et al (23), also determined that the correlation by ranges for 100 animals and obtained high values (0.691, 0.696, 0.73 and 0.71) for each method, respectively. In this investigation a Spearman correlation (rsGEBV,EBV) was also determined. The correlation values for PL, PPRO, PGRA and PL were: 0.991, 0.983, 0.989 and 0.986 and they are considered high, which indicates that there are no significant changes in the classification or ranking of animals. Spearman correlation by ranges between the MEBV and the EBV (rsMEBV,EBV) were also high (greater than 0.93), but slightly less than those obtained between the GEBV and the EBV.
In another study, Legarra et al (30) used 51325 SNPs and 2DYDs (double production of daughters) from 1756 Holstein bulls to predict genomic values (GEBV) for PL, PPRO and PGRA. The effects of the markers were estimated using the Bayes LASSO method (BL2Var). The estimation of the GEBVs was conducted through cross validation using a training group of 1216 young bulls and was compared with the 2DYD. The correlations (rGEBV;2DYD) for PL, PGRA and PPRO were: 0.41, 0.73 y 0.48 and the regression coefficients (bGEBV,2DYD) were: 0.67, 1.18 and 1.10 respectively. The results showed that the correlations (rGEBV;2DYD) were higher in PPRO and PGRA compared to the production of milk. The authors suggest that a regression coefficient less than 1 (b<1), indicates an inflation in the genetic variance in milk production traits like in the case of PL; while in the milk quality traits, the largest part of the genetic variation is captured by large QTL effects; therefore, the regression coefficients tend to be greater than 1 (b>1), like in the case of PPRO and PGRA. In this investigation it can be considered a similar behavior in PGRA, in which a regression coefficient greater than 1 (bMEBV;EBV = 1.015) was obtained, while in SCS it was less than 1 (bMEBV;EBV = 0.95).
In conclusion, the predictions of genomic values (GEBV) and molecular values (MEBV) using bayes C method were consistent with the predictions of the EBVs estimate through the conventional method (BLUP); allowing to obtain high associations between all evaluated traits and a high association in the ranking or classification of the animals established by their genomic values (MEBV and GEBV) and conventional EBV’s. On the other hand, considering the regression coefficient (bGEBV;EBV), a significant change in the magnitude between the genomic values (MEBV and GEBV) and conventional EBVs did not occur, given that the regression coefficients were close to one.
However, in this investigation it must be considered that the effects of the markers were estimated in a small reference population as a starting point in the implementation for the genomic selection and the methodology addressed presents some initial comparison results between the genomic selection model and the conventional model. Notwithstanding, it is indispensable to increase the number of genotyped animals and the number of SNPs in order to consolidate a reference population on which more reliable genomic evaluations can be conducted.
REFERENCES
1. Henderson CR. Applications of linear models in animal breeding. Guelph: CGIL Publications; 1984.
2. Fisher R. The correlation between relatives on the supposition of mendelian inheritance. Transactions of the Royal Society of Edinburgh 1918; 52:399-433.
3. Cole JB, VanRaden PM, O’Connell JRO, Van Tassell CP, Sonstegard TS, Schnabel RD et al. Distribution and location of genetic effect for dairy traits. J Dairy Sci 2009; 92(6):2931-2946.
4. Kahi AK, Rewe TO, Kosgey IS. Sustainable community-based organizations for the genetic improvement of livestock in developing countries. Outlook Agric 2005; 34(4):261-270.
5. Godard ME, Hayes BJ. Genomic Selection. J Anim Breed Genet 2007; 124(6):323-330.
6. Meuwissen THE, Hayes B, Goddard M. Prediction of total genetic value using genome-wide dense marker maps. Genetics 2001; 157(4):1819–1829.
7. Dekkers JC. Commercial application of marker and gene assisted selection in livestock: strategies and lessons. J Anim Sci 2004; 82(E-Suppl):E313-328.
8. Hayes BJ, Bowman PJ, Chamberlain AC, Goddard ME. Genomic selection in dairy cattle: progress and challenges. J Dairy Sci 2009; 92(2):433–443.
9. Schefers J, Wigel KA. Genomic selection in dairy cattle: Integration of DNA testing into breeding programs. Anim Front 2012; 12(1):4-9.
10. Calus MPL. Genomic breeding value prediction: methods and procedures. Animal 2010; 4(2):157-164.
11. Moser G, Tier B, Crump RE, Khatkar MS, Raadsma HW. A comparison of five methods to predict genomic breeding values of dairy bulls from genome-wide SNP markers. Genet Sel Evol 2009; 41:56.
12. Meuwissen T, Hayes B, Goddard M. Accelerating Improvement of livestock with Genomic Selection. Annu Rev Anim Biosci 2013; 1:221-237.
13. VanRaden PM, Van Tassell CP, Wiggans GR, Sonstegard TS, Schnabel RD, Taylor JF, Schenkel FS. Invited review: Reliability of genomic predictions for North American Holstein bulls. J Dairy Sci 2009; 92 (1):16-24.
14. Duchemin SI, Colombani C, Legarra A, Baloche G, Larroque H, Astruc JM et al. Genomic selection in the French Lacaune dairy sheep breed. J Dairy Sci 2012; 95(5):2723-2733.
15. Echeverri J, Zambrano JC, López-Herrera A. Genomic evaluation of Holstein Cattle in Antioquia (Colombia): a case study. Rev Colomb Cienc Pecu 2014; 27:306-314.
16. Ali AK, Shook GE. An Optimun transformation for somatic cell concentration in milk. J Dairy Sci 1980; 63(3): 487-490.
17. Echeverri J, López A, Parra J. Software control 1. [CD-ROM]. Versión 1. Medellín: Universidad Nacional de Colombia sede Medellín; 2010.
18. SAS. Statistical Analysis Systems [CD-ROM]. Versión 9.1 Cary, NC, USA: SAS Inst, Inc; 2006.
19. Purcell S, Neale B, Todd-Brown K, Thomas L, Ferreira M, Bender D et al. PLINK: a toolset for whole-genome association and population-based linkage analysis. Am J Hum Genet 2007; 81(3):559-575.
20. Mrode RA, Thompson R. Linear models for the prediction of animal breeding values. Cambridge: CABI Publishing; 2005.
21. Boldman K, Kriese L, Van Vleck L, Van Tassell C, Kachman S. MTDFREML: A Set of programs to obtain estimates of variances and covariances. [Programa de computadora]. Clay Center (NE): USDA-ARS; 1995.
22. Kizilkaya k, Fernando RL, Garrick DJ. Genomic Prediction of simulated multibreed and purebred performance using observed fifty thousand single nucleotide polymorphism genotypes. J Anim Sci 2010; 88(2):544-551.
23. Verbyla KL, Bowman PJ, Hayes BJ, Raadsma H, Goddard ME. Sensitivity of genomic selection to using different prior distributions. BMC Proc 2010; 4(1):S5.
24. Legarra A, Ricard A, Filangi O. GS3: Genomic selection, Gibbs sampling, Gauss Seidel and Bayes Cpi. [Programa de computadora] Toulouse: Inra; 2013.
25. Mäntysaari E, Zengting L, Van Raden P. Interbull Valdation Test for Genomics Evaluations. Interbull Bolletin 2010; 41:17-22.
26. Lillehammer L, Meuwissen THE, Sonesson AK. A comparison of dairy cattle breeding designs that use genomic selection. J Dairy Sci 2010; 94:493-500.
27. Calus MPL, Veerkamp RF. Accuracy of breeding values when using and ignoring the polygenic effect in genomic breeding value estimation with a marker density of one SNP per cM. J Anim Breed Genet 2007; 124:362–368.
28. Muir WM. Comparison of genomic and traditional BLUP estimated breeding value accuracy and selection response under alternative trait and genomic parameters. J Anim Breed Genet 2007; 124:342–355.
29. Visscher PM, Yang J, Goddard MEA. A commentary on “common SNPs explain a large proportion of the heritability for human height” by Yang et al. (2010). Twin Res Hum Genet 2012; 13:517–524.
30. Legarra A, Robert-Granié C, Croiseau P, Guillaume F, Fritz S. Improved Lasso for genomic selection. Genet Res Camb 2011; 93(1):77-87.